We’ve added the IMPORTRANGE function to support referencing data across multiple workbooks.
The function takes two arguments (source workbook URL and source range) and returns the corresponding data. You must have access to copy the source workbook in order to import data. Data is automatically kept in sync when the source data changes.
Spilled range operator
The spilled range operator (#) lets you reference an entire spilled range dynamically in a formula. In the example below, cell A1 =SEQUENCE(2,3) which spills into A1:C2. We then can use SUM(A1#) to sum all of the values in the spilled array range, which equals 21.
As we change the formula in A1 to SEQUENCE(3,3), the downstream formula dynamically updates to the new sum, 45.
The spilled range operator (#) is placed after the cell reference in a formula.
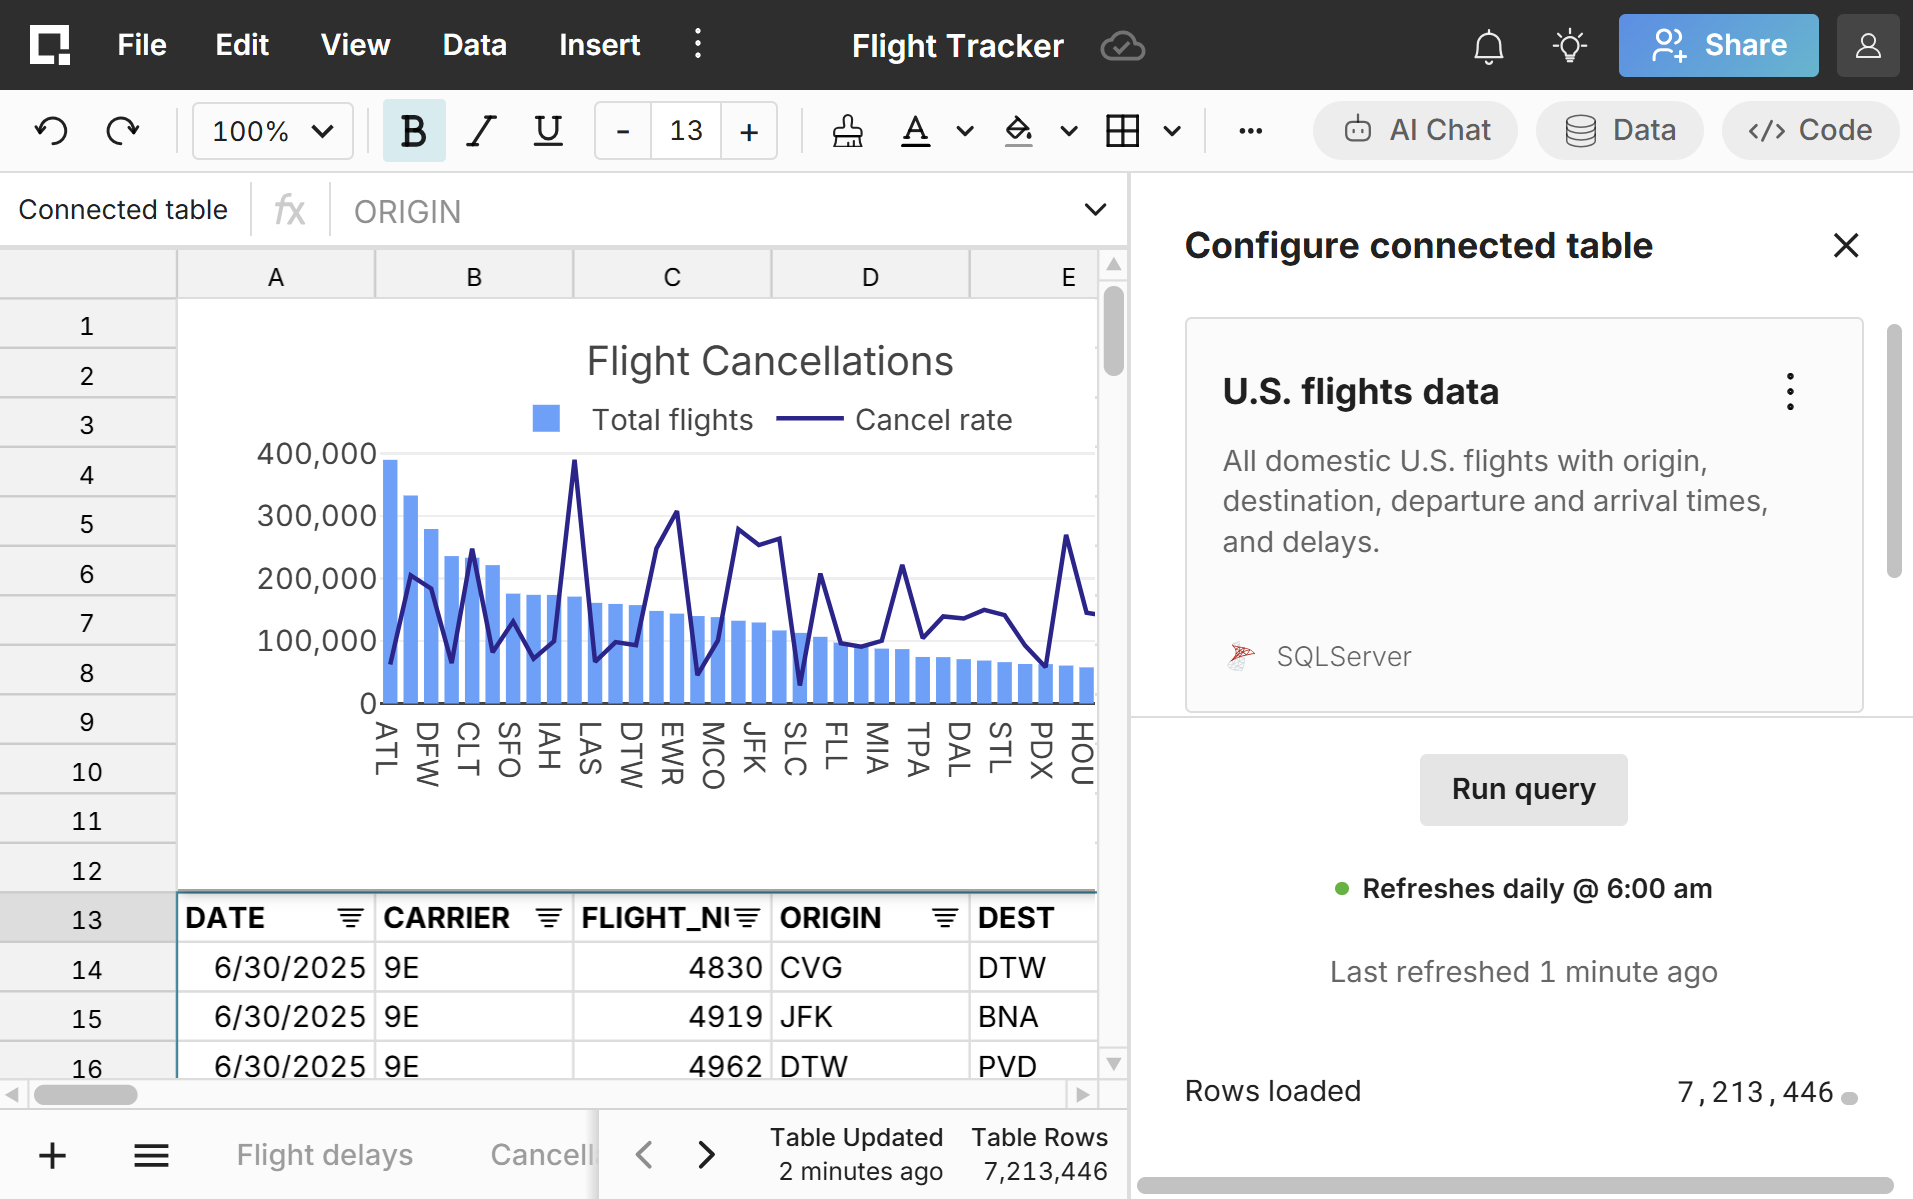
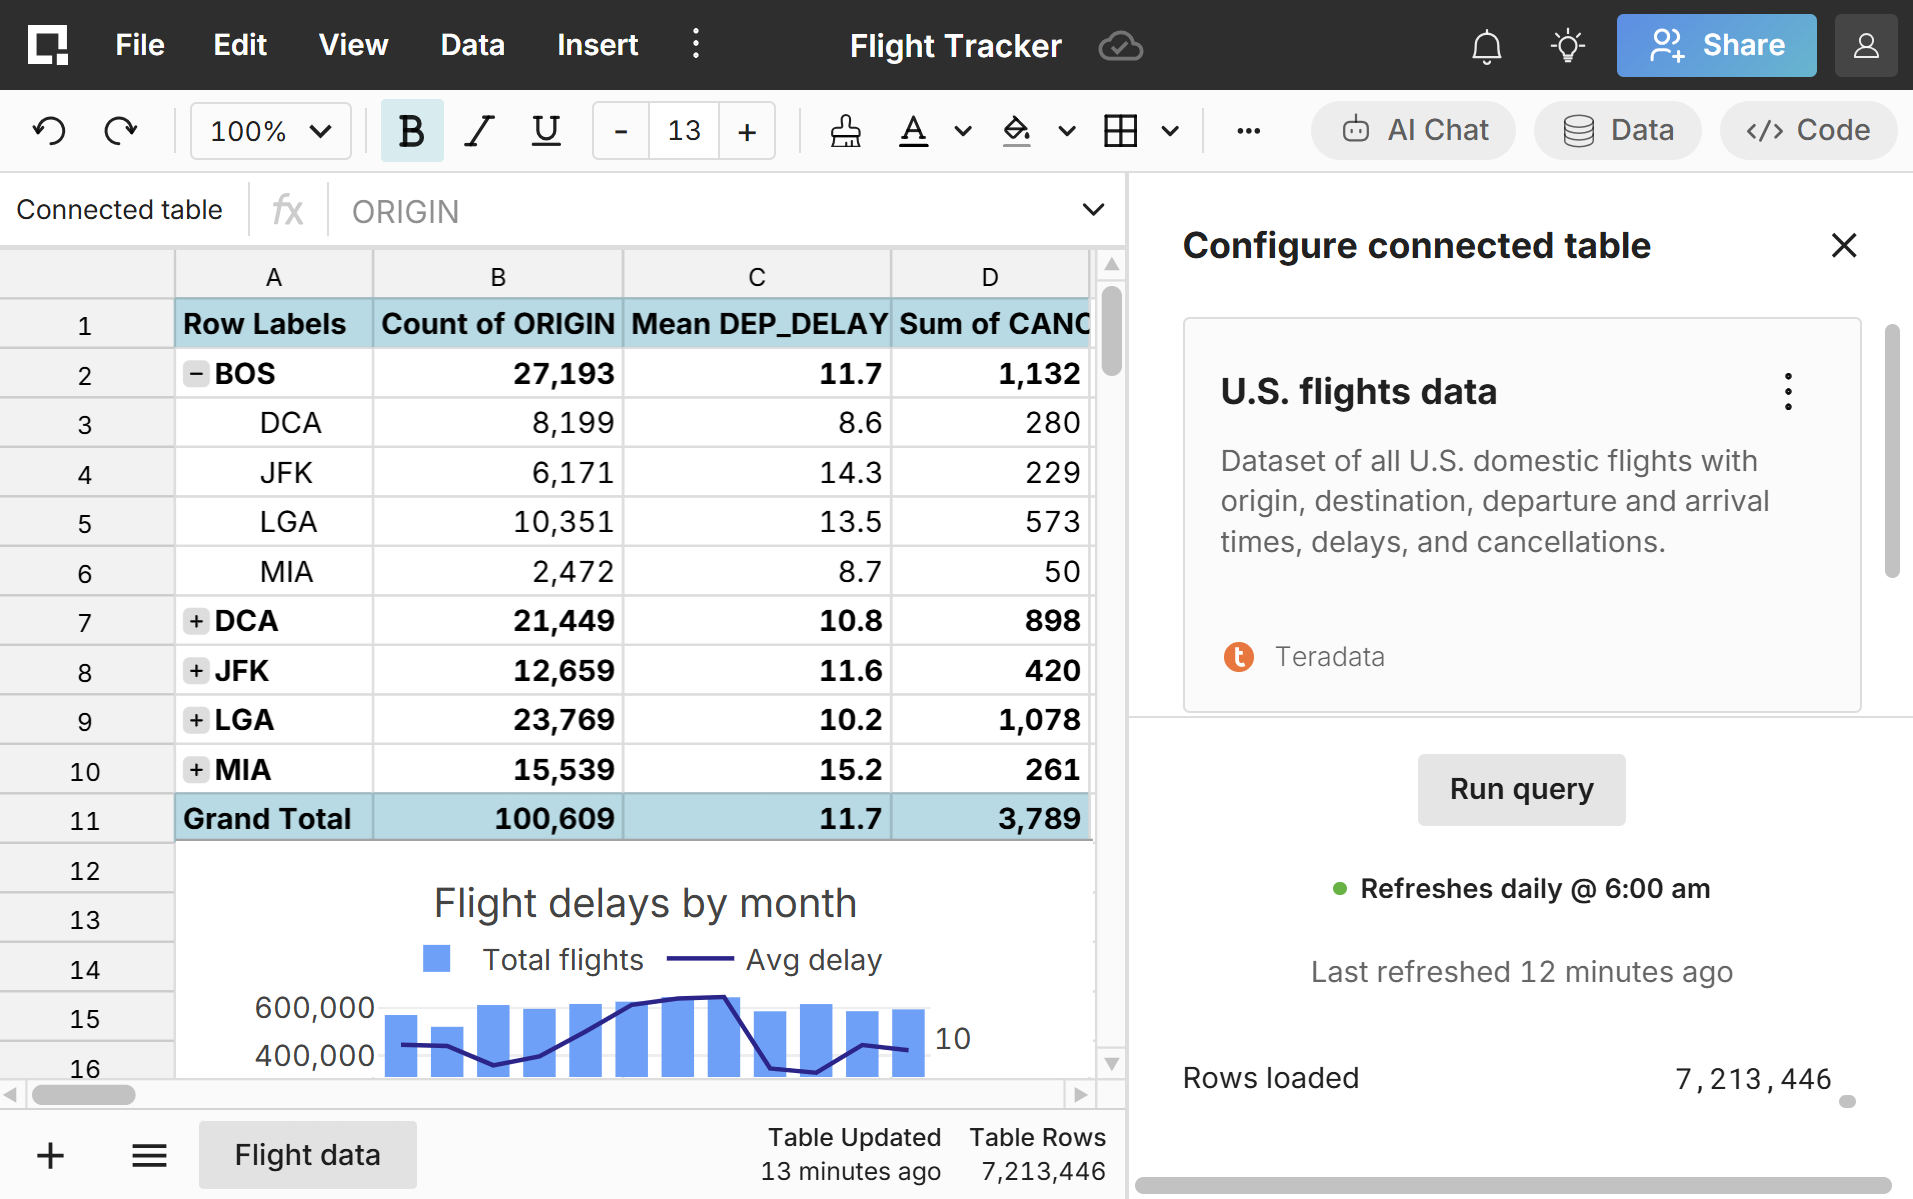
Row Zero now has a built-in Teradata connector, so you can seamlessly import and export data between your spreadsheets and Teradata. Everything built on connected data updates as source data is refreshed, including pivot tables, charts, formulas, etc. See how to connect to Teradata here.
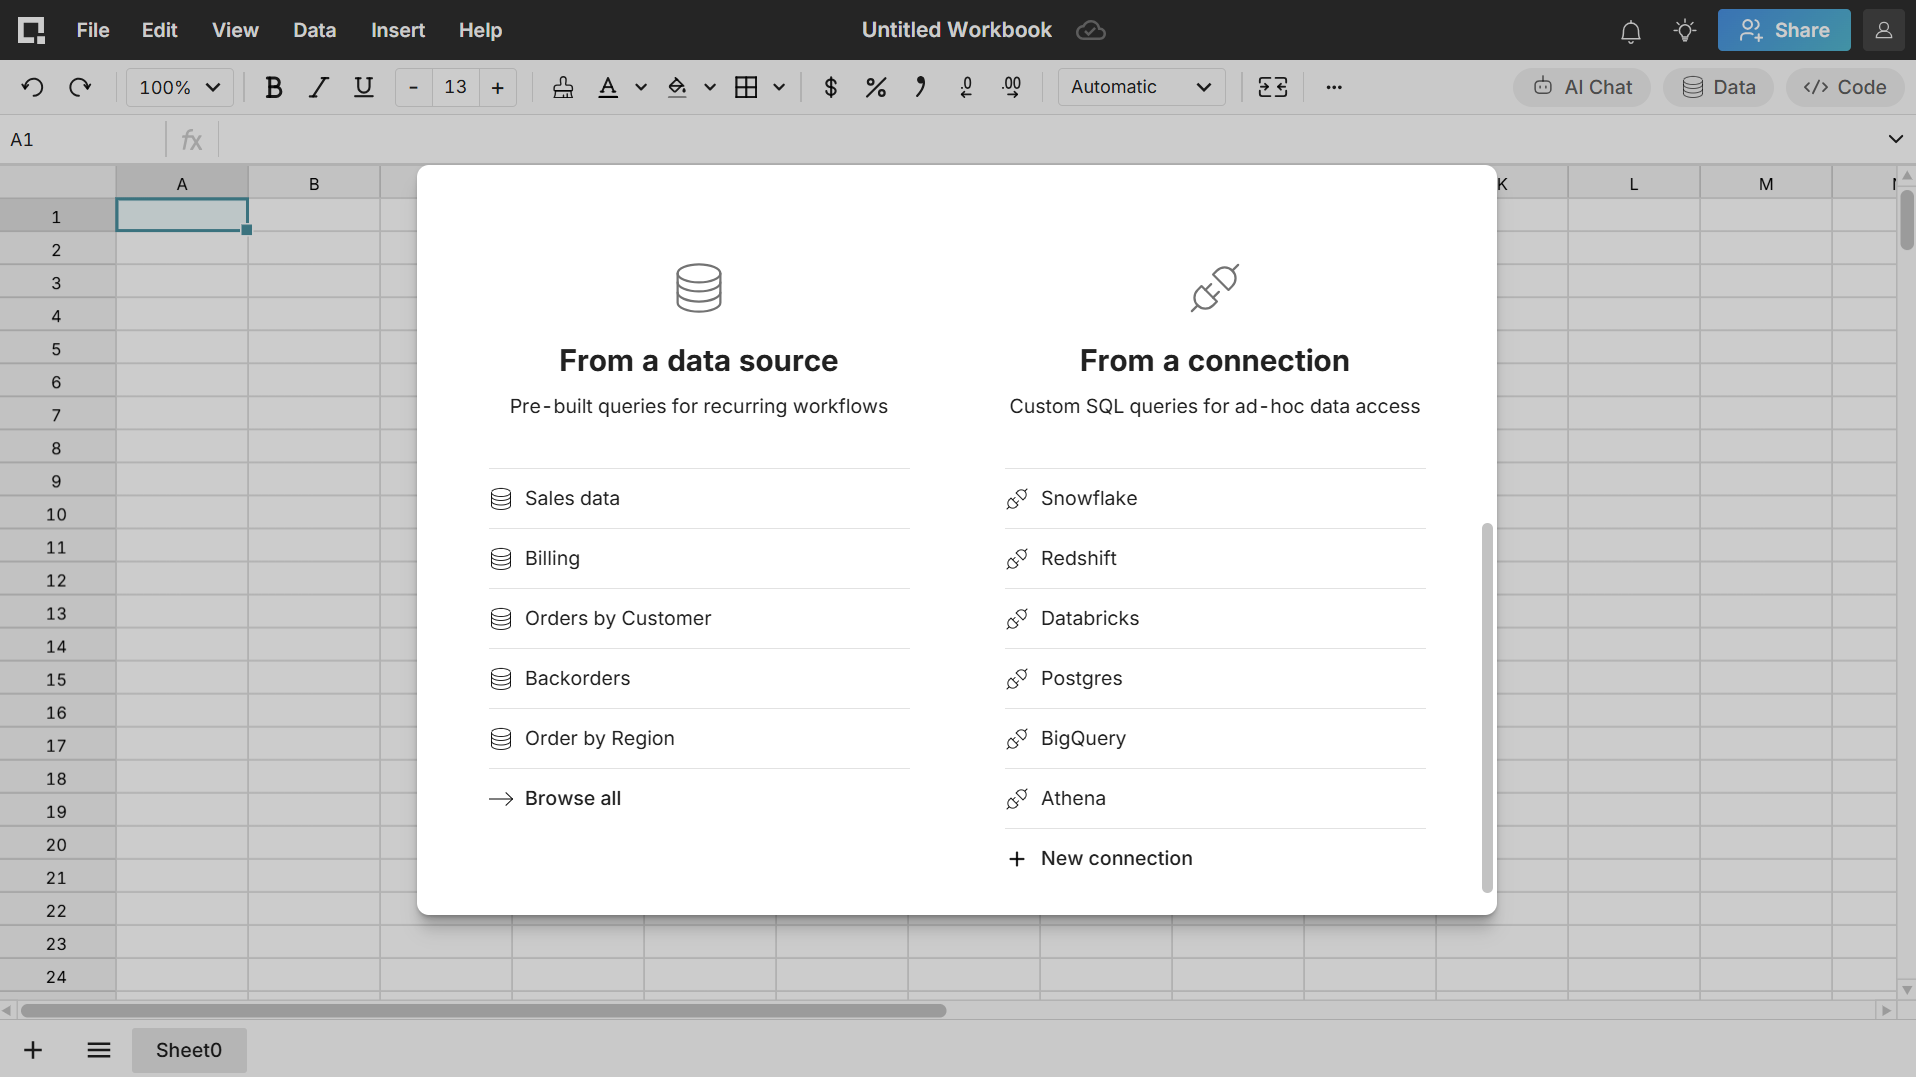
We added a data picker that makes it easy to choose either a pre-built data source or an existing data connection. You can access it from the homepage by clicking Database query, or from a workbook via Insert > Connected table.
03.06.2026
AI Chat now generally available
AI Chat is now available for Free, Pro, and Business users. AI Chat makes it easy to analyze massive datasets with natural language prompts and returns spreadsheet functions and features so analysis is fully auditable and editable.
Free, Pro, and Business users get a weekly allocation of AI tokens and access to our default model selection, which runs on Amazon Bedrock. Enterprise customers can “bring your own key” to connect workbooks to their AWS Bedrock, OpenAI, Anthropic, or Google Gemini account and work without daily limits. Learn more here.
02.27.2026
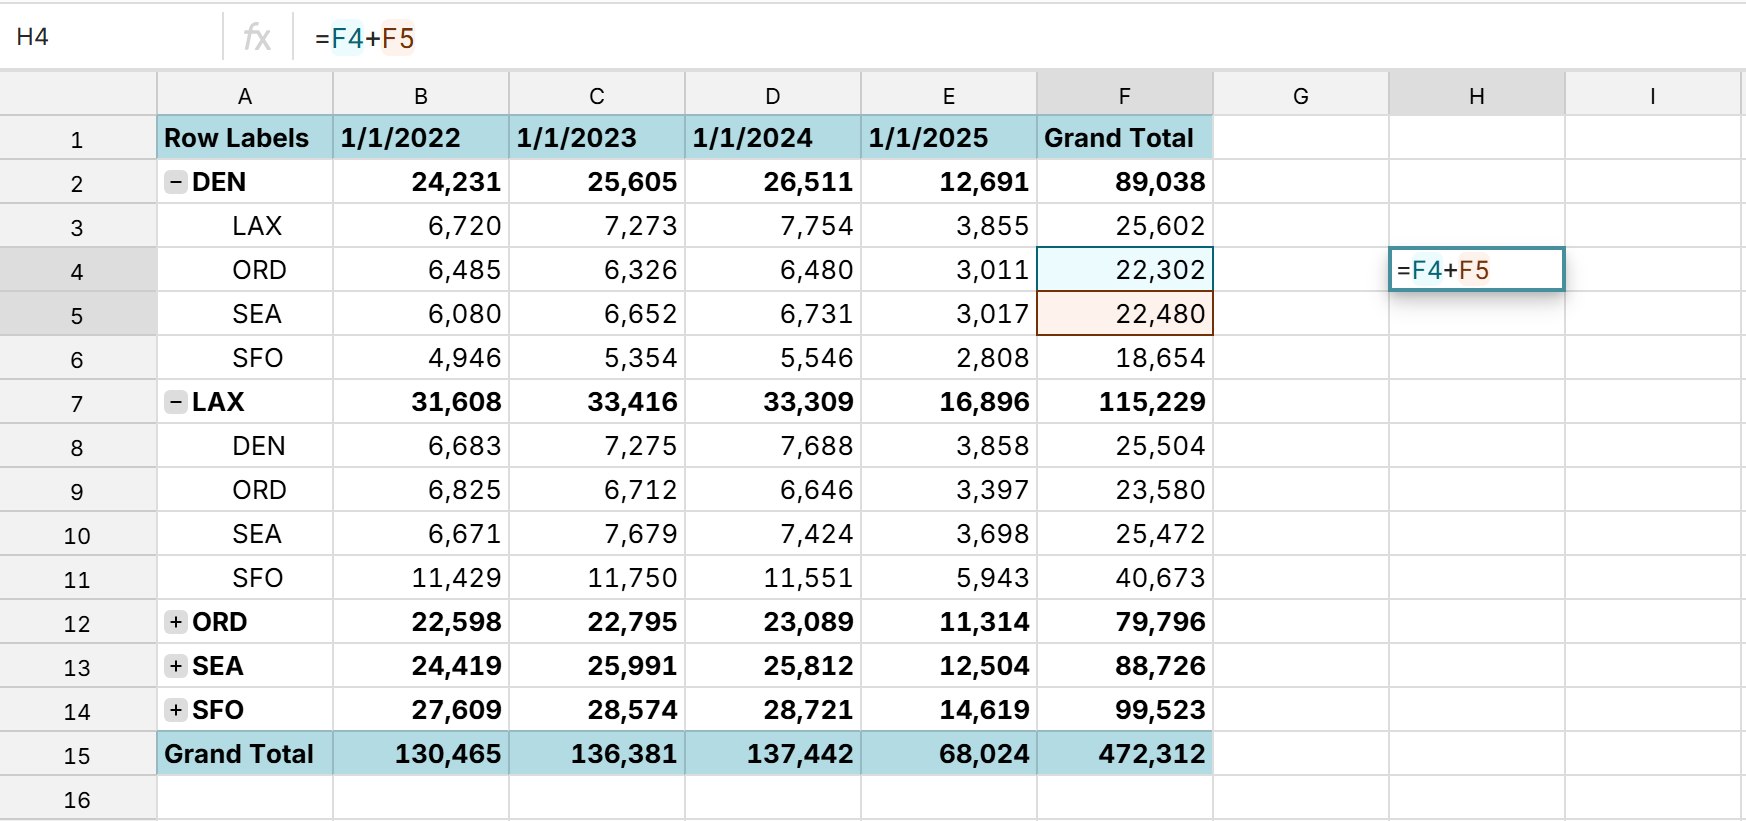
New pivot table modes
Row Zero now has two modes for pivot tables, which you can select depending on your use case:
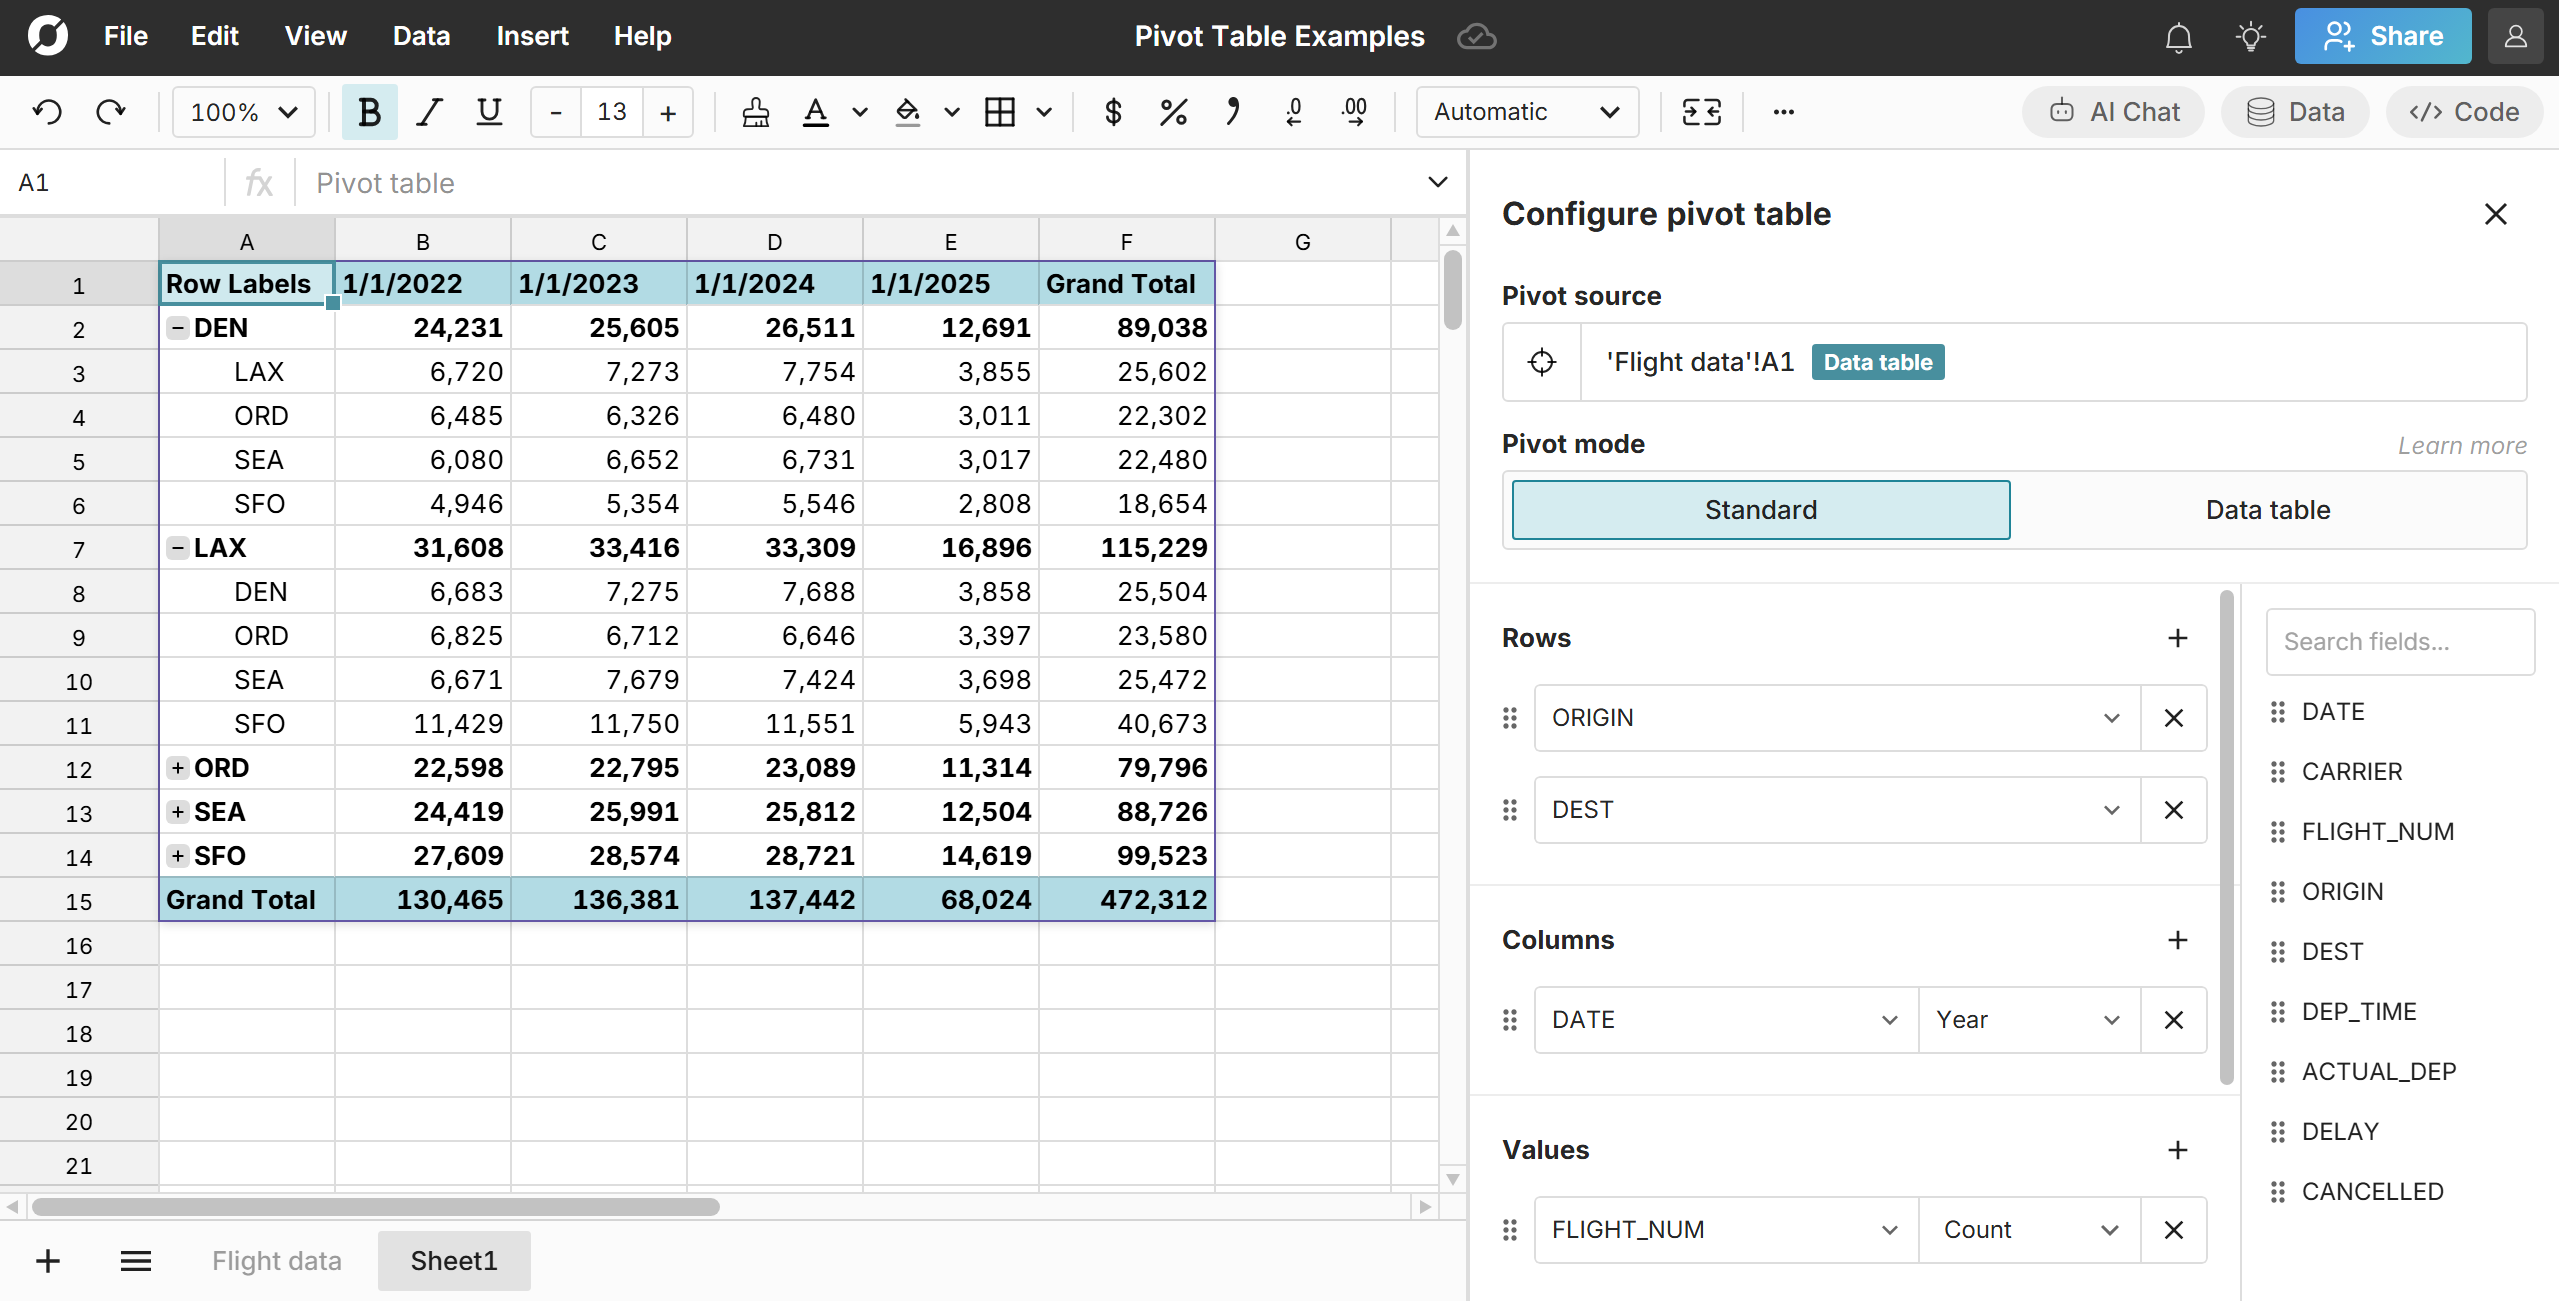
The new Standard mode is best for final presentation of data and supports nesting fields, collapsible groupings, and subtotals.
The Data table mode supports computed columns, filter/sort, and is best for transforming data and creating dynamic charts. Data table mode gives you the same pivot table experience you've had so far in Row Zero.
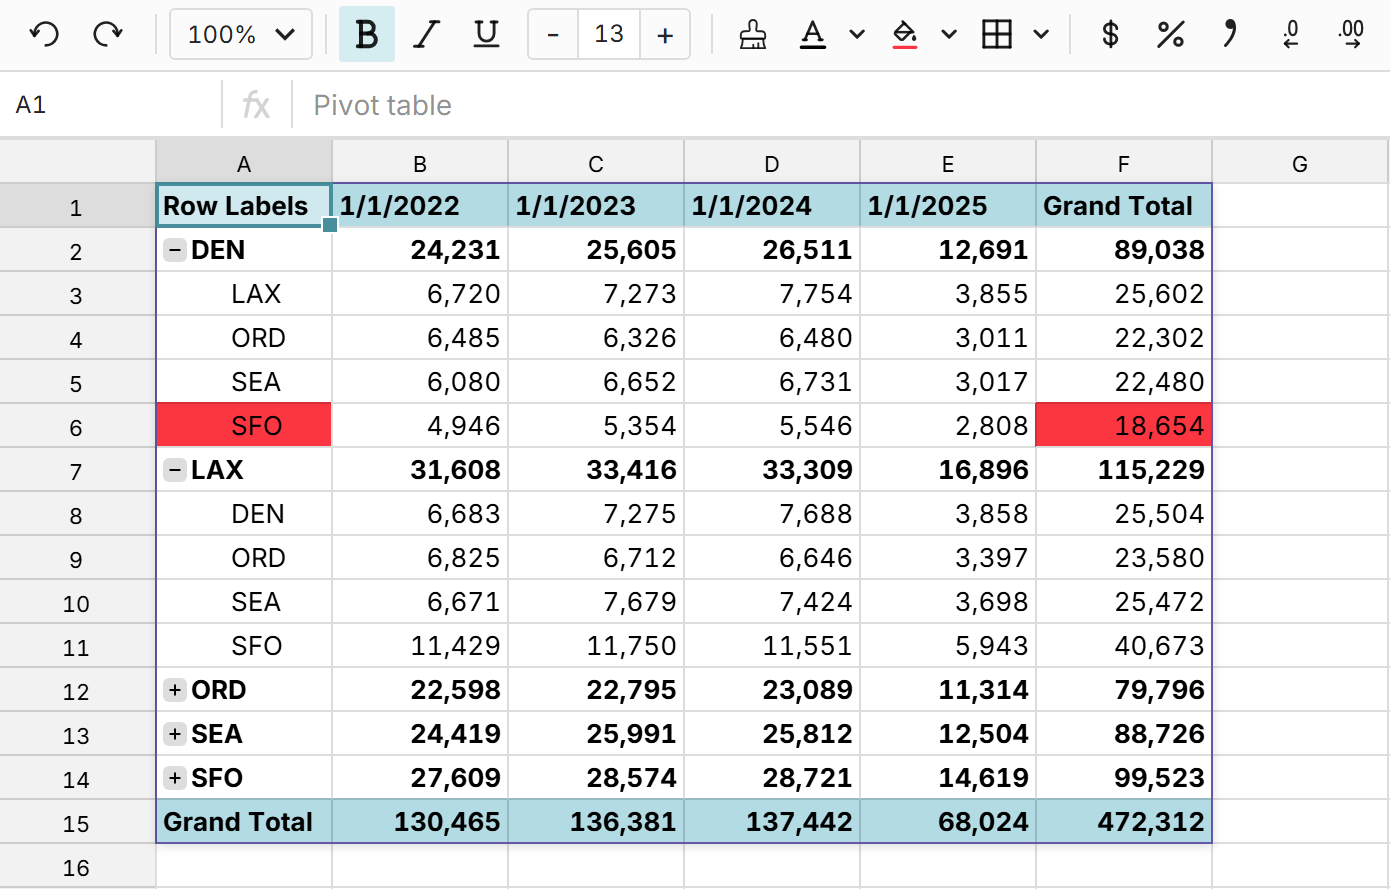
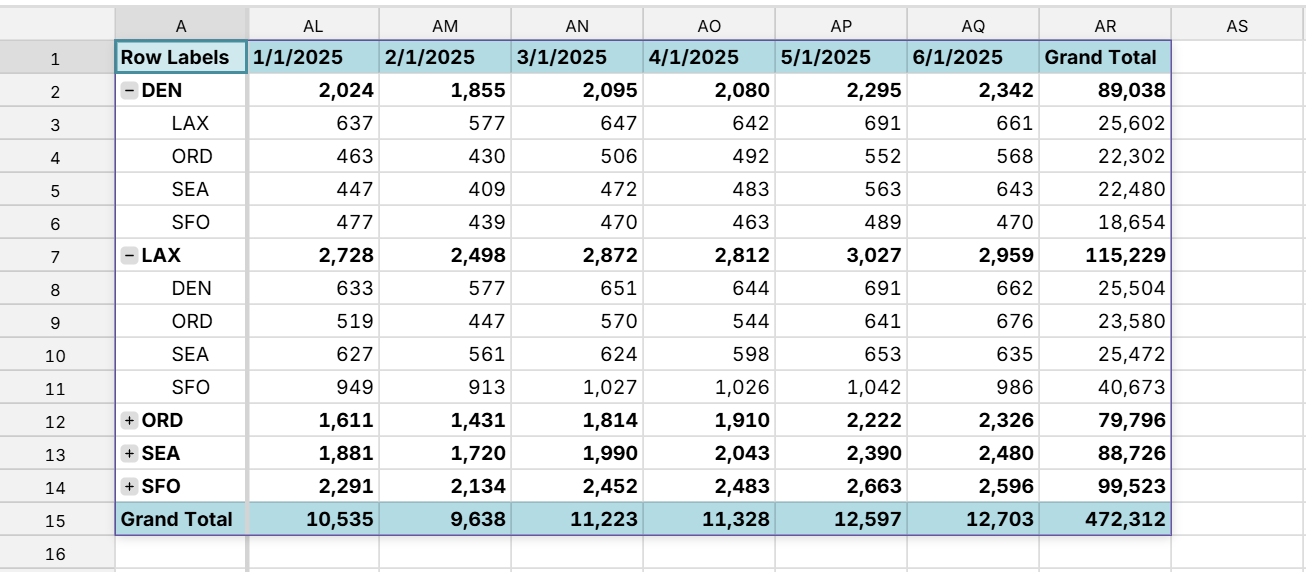
Here's a breakdown of the new functionality in Standard mode:
1. Built-in subtotals, nested fields, and collapsable groupings when you add multiple fields to Rows or Columns.
2. Standard mode supports cell references, so you can easily reference any cell in a pivot table in downstream formulas.
3. Standard mode lets you format individual cells in the pivot table.
4. You can freeze columns in Standard mode so you can keep row labels in view as you scroll right.
5. If you export a sheet to CSV, Standard pivot data is included in the export.
You can now add comments directly in a workbook. Right-click to add comments to cells, charts, and tables.
You can @ mention specific users, who will be alerted to new comments via the notifications bell in the top right corner.
You can also view all comments in a workbook by going to View > Comments in the navigation.
Charts show a yellow dot in context where the comment was added. Cells with comments have a yellow triangle in the top right corner. Both show the comment on hover.
Resolving a comment hides it in the sheet, but it will still show under "Resolved" when you view all comments so that you can track completed work.
02.09.2026
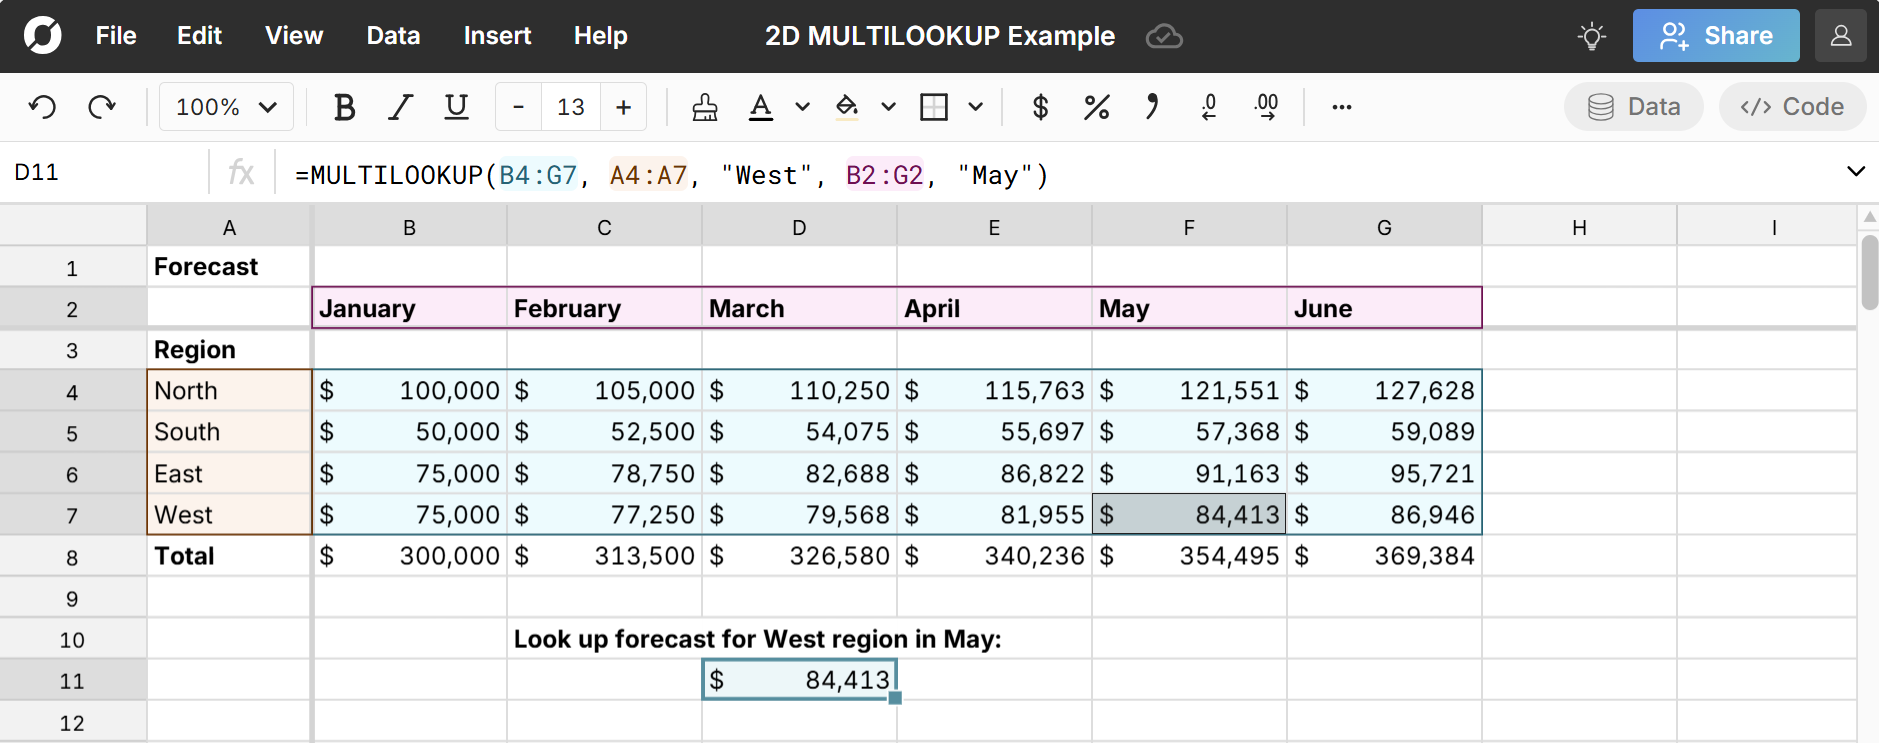
Two-Dimensional MULTILOOKUP
We've updated our MULTILOOKUP function so that you can lookup across a row and column at the same time to return the intersecting value.
This is especially helpful for lookups in financial spreadsheets where you want to return a value from a given category row in a given month column and can be used in place of complex INDEX/MATCH or nested XLOOKUP formulas.